Every now and then, somebody will question ROI metrics reported by B2B tech vendors. Let’s take the following LinkedIn post for example:
Tech vendors’ use of the term “ROI” is maddening. Two recent (ROI claims) triggered this rant.
- “Did you know that financial services firms that use Salesfarce achieve a 188% ROI?” Really? EVERY ONE OF THEM achieve the same exact ROI? And how exactly was that ROI measured?
- “74% of companies are already achieving a return on their Gaggle GenAI investments.” Duh. Any positive improvement from an investment is a “return” on the investment. But it’s the quantification of the costs and benefits that enables a company to see what the ROI is, and – more importantly – how that ROI compares to other potential investments the company could have made.
- The Gaggle study went on to say that 45% of the firms they surveyed said that “employee output has at least doubled” from their GenAI implementations. Oh, ok. So I guess if my company implements “Gen AI”, our employee output may “at least double” as well, right?
The OP Ron Shevlin is fully justified in his rant. If I were a prospective customer for an enterprise software, I’d also have the same questions.
But ROI figures are reported by vendors, so we need to take a look at this from their pov to get the full picture on this topic.
B2B Tech marketers face two key challenges in the rigorous estimation of the ROI of ERP, CRM, Marketing Automation and other enterprise software:
- Computing challenge
- Reporting challenge
1. Computing Challenge
ROI is defined as follows:
ROI = Incremental benefits delivered by software/Cost of the software.
Depending on the nature of the software, there are various sources of benefits:
- Reduction in Days of Sales Outstandings (DSO)
- Increase in Inventory Turns, ergo reduced inventory carrying costs
- Reduction in shipping costs and demurrages
- Increase in lead-to-deal conversion rate, ergo sales
- Increase in Net Dollar Retention (NDR), ergo revenue.
TIL NDR (Net Dollar Retention):
Revenue from customers this year for every $100 spent on you by the same customers last year, inclusive of customers whose spending dropped to $0.
Higher the better e.g. Snowflake 175%.#SAAS . H/T @ByrneHobart pic.twitter.com/JtDEJcPRLv— GTM360 (@GTM360) December 13, 2022
As you can see, all benefits are incremental, ergo a rigorous computation of ROI requires data about both the post-implementation (TO-BE) and the pre-implementation (AS-IS) states of the business.
TO-BE data can be gathered fairly easily but AS-IS data is often not available due to the immature state of the AS-IS IT landscape.
Put differently, if the customer had all the AS-IS data, their systems were good enough and they wouldn’t have bought the enterprise software in the first place!
2. Reporting Challenge
Customers have varying degrees of success in implementing enterprise software e.g. Ten retailers may succeed in implementing SAP but one retailer might find its SAP project getting derailed by reasons that sound silly.
Accordingly, ROIs obtained by different companies can vary.
This creates the following challenge: Whose ROI should I report?
Should it be the
- Max ROI obtained by any customer in the installed base
- Median ROI obtained by all customers that computed ROI
- Median ROI obtained by all customers that were succesful in the implementation (and got ROI)
- Median ROI obtained by all customers that were succesful in the implementation (and got ROI) and customers that failed in the implementation (and got zero or negative ROI).
Vendor marketers would like to report A – after all, if their software got so-and-so ROI for one customer, it’s basically capable of delivering the same ROI for all customers, it just depends on how they use the software.
Pedantics would argue that D is the most accurate representation of the impact of the software.
I’ve been doing this for 30+ years and I’ve never managed to get consensus among vendors or customers on this topic.
Ergo, we tech marketers are forced to resort to
E. None of the above
and customers see the kind of ROI metrics they see and rants like the above will continue forever.
(There’s another challenge caused by the drive to protect competitive advantage where customers get tangible benefits but do not permit the vendor to disclose them publicly. While it’s very real, I’ve ignored this challenge since it can be substantially overcome by following the pro tips given in my blog post entitled 3 Ways To Get Approvals For Case Studies From Reluctant Customers.)
In the absence of full information on the benefits of enterprise software, many customers juxtapose qualitative assessment with whatever quant data they have.
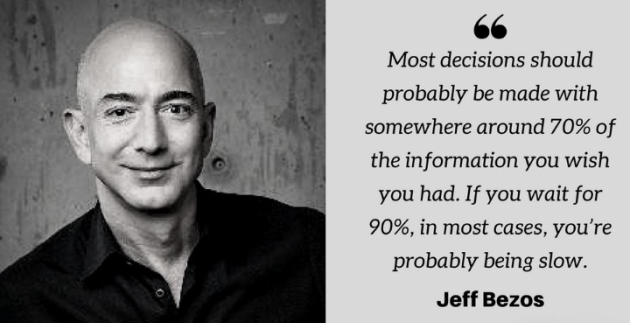
Following the Jeff Bezos’s playbook, many companies dipstick the BEFORE-AFTER scenarios in various business processes and functions, and use their experience and intuition to judge whether they’ve got their money’s worth from their enterprise software.
Which is not a bad thing.
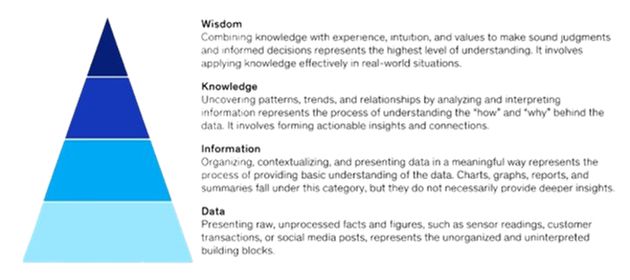
End of the day, wisdom plays an important role in all business decisions. According to McKinsey, while data is at the foundation of the DIKW Data Maturity Model, the combination of knowledge, experience and intuition aka wisdom comes at the top of the model. You can see a few examples of decisions driven by wisdom in my blog post titled 3 Ways To Find Hidden Pain Areas.
As long as they’re well-informed, companies don’t need to be defensive about taking decisions based on an optimum mix of data and gut feeling. Going by the aforementioned Jeff Bezos playbook, optimum is somewhere around 70% data and 30% gut feeling. And, in the event of a tie between data and anecdote, lean towards anecdote, per another Bezos best practice:
When the data and the anecdotes disagree, the anecdotes are usually right.
In closing, I recently came across an excellent analysis and computation of ROI for an enterprise AI software: ROI For AI – Prosus Toqan.