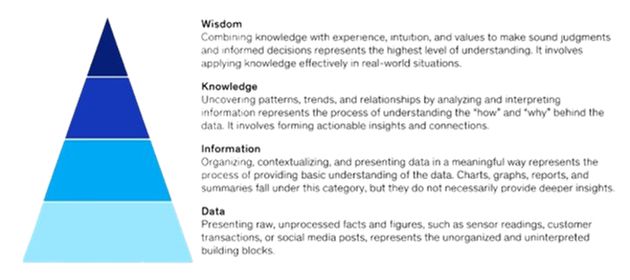
In From raw data to real profits: A primer for building a thriving data business, McKinsey proposes the so-called DIKW model for Data Product vendors where:
- D is Data
- I is Information
- K is Knowledge
- W is Wisdom
For the uninitiated, the largest consulting firm in the world defines “data product” as follows:
What is a data product?
A data product delivers ready-to-use data set that can be analyzed and applied to various use cases to answer critical business questions.
In this post, I’ll test drive the DIKW model with data from a grocery store’s POS system.
Example: Pizza Coke Sales
The POS terminal of a grocery store yields the following DIKW exhaust.
Data
Given below is the raw data of sales of different SKUs during a week.
| Mon | Tue | Wed | Thu | Fri | Sat | Sun | |
| Pizza | 80 | 82 | 65 | 97 | 120 | 130 | 90 |
| Coke | 40 | 40 | 30 | 45 | 60 | 63 | 42 |
| Detergent | 35 | 13 | 11 | 14 | 35 | 25 | 30 |
Information
Visualize the above data.
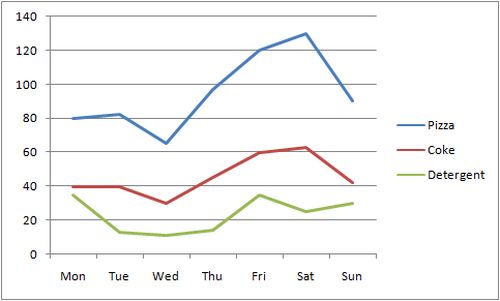
Knowledge
Eyeballing the above chart suggests a strong correlation between sales of pizza and coke, but not so much between coke and detergent or detergent and pizza. Let’s investigate that further by computing the regression coefficients of the three SKU-pairs’ sales:
| Pizza-Coke | 0.9929 |
| Coke-Detergent | 0.4894 |
| Detergent-Pizza | 0.4317 |
Bingo! Only the Pizza-Coke regression coefficient is above 0.95, which is the standard threshold for correlation. That confirms our surmise that there’s a strong correlation between sales of pizza and coke.
Now, let’s derive the relationship between Pizza and Coke. With some help from ChatGPT on scatter chart and regression analysis, I arrived at the chart shown in the following exhibit:
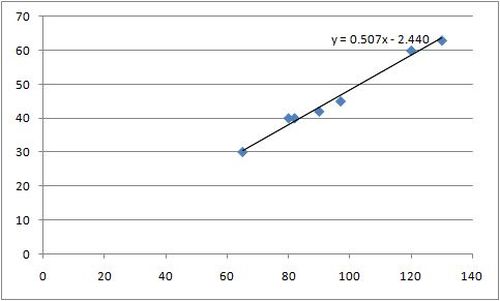
The relationship is:
Coke Sales = 0.507*Pizza Sales – 2.440.
Wisdom
We can round off the above equation to:
Coke Sales = 0.5*Pizza Sales.
In plain English, it means that “Coke sales is roughly half of pizza sales”.
By combining this knowledge with their experience and intuition, store managers can take the following actions:
- Strategic Placement: Place Coke near the Pizza section or near checkout counters to prompt impulse buys.
- End Cap Displays: Use end caps or other prominent display areas to showcase both Pizza and Coke together.
- Stocking: Keep adequate stock of Coke, especially near the Pizza section, to avoid missed sales opportunities.
This wisdom helps the grocery store to optimize sales and improve customer experience.
I had a déjà vu feeling about the DIKW framework. I felt it resembled the good old Analytics Maturity Model.
For the uninitiated, the AMM goes through the following stages:
- Descriptive
- Predictive
- Prescriptive.
The McKinsey article was silent on this resemblance. I asked ChatGPT for its thoughts. I’m summarizing its answer below:
DIKW v. Analytics Maturity Model
In summary, while the DIKW pyramid focuses on the transformation of raw data into actionable wisdom, the analytics maturity model outlines the stages of data analysis from understanding past data to making future recommendations. Both frameworks emphasize a progression from basic data handling to advanced decision-making, but they frame this progression differently.
tl;dr: DIKW and Analytics Maturity Model are similar in some ways and different in other ways.