Many people conflate the amount of payments processed in a country with the country’s GDP.
This is wrong: GDP drives, but does not cap, TPV.
Take the COO of a leading mobile payment fintech:
April loss of business is $80bn approx vs cost of vaccinating India $8bn:
RTGS – 🔻33%
NEFT – 🔻34%
UPI – 🔻3%
IMPS – 🔻9%
Credit Card – 🔻19%
Debit Card – 🔻18%
CTS – 🔻24%
Cash – 🔻11%— Deepak Abbot (@deepakabbot) May 1, 2021
His tweet equates the fall in digital payments with the drop in GDP caused by the pandemic outbreak.
Actually, the opposite has happened! Industry analysts have predicted an increase in digital payments value due to Covid-19!
While GDP comes out of commercial activity and commercial activity triggers payments, there are many other factors that influence payments way more than GDP.
(Many people colloquially refer to the value of payments processed (TPV or Total Payments Value) as “payment volumes”. But that’s wrong since the term payment volume refers to the number of payment transactions processed. From now onwards in this post, I will use the term “Payment Value” or “Total Payments Value” or TPV whenever I refer to the rupee or dollar value of payments.)
Let me start with a thought experiment.
EXAMPLE-1
I send you ₹1. You send the ₹1 back to me. I send it to you again. You send it back to me again. We keep doing this for a year. It takes 2 minutes for a round trip on any standard UPI app – that’s what it took when I tested this on Walmart PhonePe app.
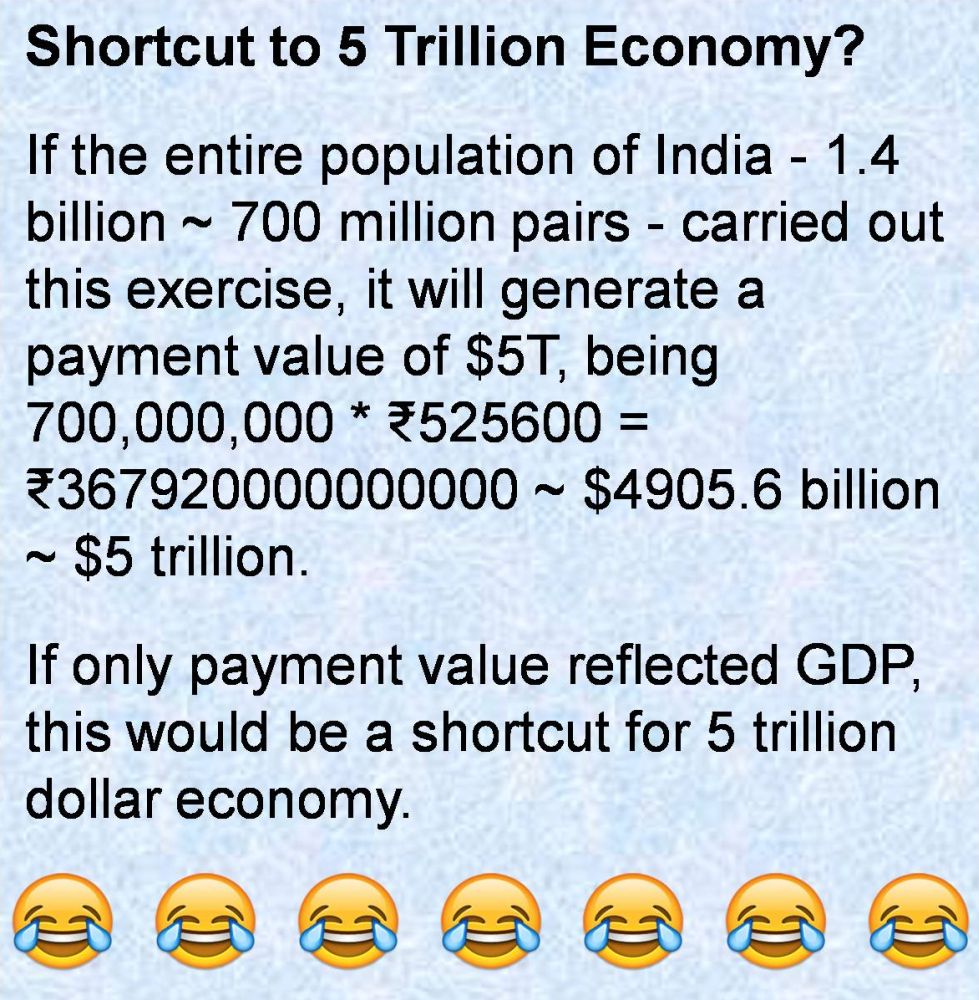 This will generate payments value of ₹1 + ₹1 = ₹2 per round trip.
At 2 minutes per round trip, there will be 30 round trips per hour.
At ₹2 per round trip, this will generate a payment value of ₹60 per hour ~ ₹1440 per day (@24 hours/day) ~ ₹525,600 per year (@365 days/year).
How much GDP do these payments generate? ZERO.
I agree that was a ridiculous example.
(On a more ridiculous note, if the entire population of India engaged in this activity, this could be a shortcut to the much vaunted 5 trillion dollar economy, as explained in the exhibit on the right!)
Now, let’s take a more realistic example.
EXAMPLE-2
You buy a coffee for ₹100. This generates GDP of like amount.
The coffee shop owner collects ₹100 from you and pays out ₹80 to various parties as follows:
- Coffee bean supplier: ₹30
- Sugar supplier: ₹10
- Milk supplier: ₹5
- Rent and Utilities: ₹10
- Wages: ₹15
- Banking Fees: ₹5
- Insurance: ₹5
This transaction triggers total payments of ₹100 + ₹80 = ₹180.
A ₹100 GDP event generates a total of ₹180 in payment value.
If the coffee shop’s suppliers have their own suppliers, then your purchase triggers even more downstream payments.
Accordingly, for the same GDP, payment value increases in proportion with the depth of supply chain.

EXAMPLE-3
You buy ₹10,000 worth of shares. This triggers the following payments:
- From you to your brokerage firm: ₹10,000
- From brokerage firm to stock exchange: ₹10,000
- From stock exchange to seller’s brokerage firm: ₹10,000
- From seller’s brokerage firm to seller: ₹10,000
TOTAL: ₹40,000.
The GDP generated by this transaction is the brokerage you pay to your broker, which is ₹0 if you use a zero brokerage broker like Zerodha in India or Robinhood in USA, or around ₹50 if use a full service broker like ICICIdirect in India or TD Ameritrade in USA.
To summarize:
- Example-1: GDP = 0, Payment Value = ₹525,600
- Example-2: GDP = ₹100, Payment Value = ₹180+
- Example-3: GDP = ₹0-50, Payment Value = ₹40,000.
As you can see, payment value differs significantly from GDP.
I don’t have the figures for India but take the following count (volume) and amount (value) of payments in USA (2015):
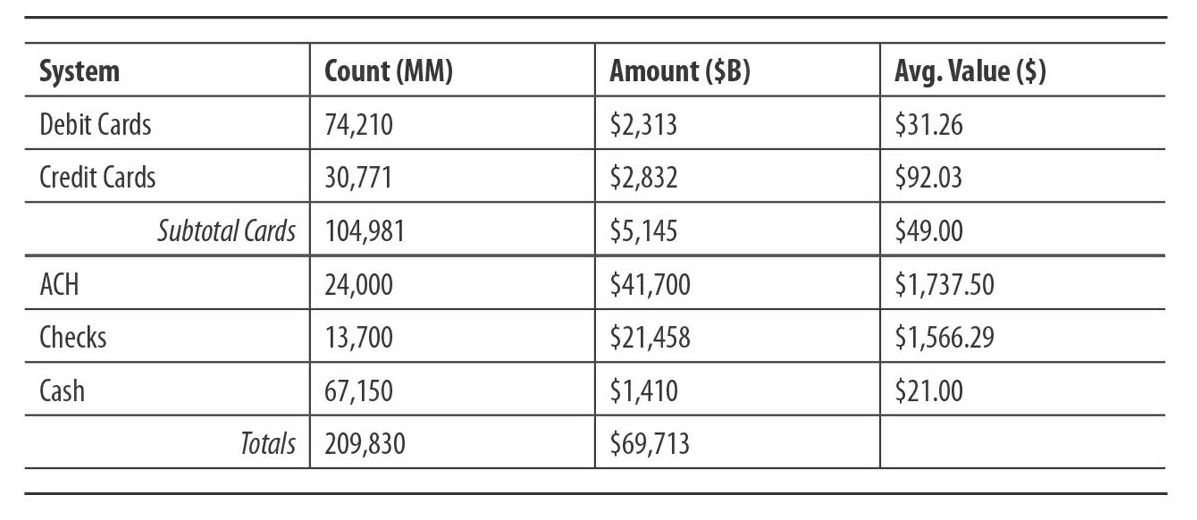
As noted by the authors of Payments Systems in the U.S., the source of the above data:
The totals shown are large – much larger than the US Gross National Product. This is because a single commercial transaction (such as a consumer purchase) can result in multiple payments, as the various parties in the value chain move funds to effect payment, settlement, etc.
FI-to-FI payments is another source of massive payment flows that are not accompanied with commensurate GDP. These are payments made between Financial Institutions to settle credit card, securities and other transactions. They typically use wire transfers / RTGS (and are not reflected in TPV of UPI, FPS, Zelle and other A2A RTPs).
Note that wire transfers are excluded in the above table. Had they been included, they would represent less than 1% of the total “count”, but 93% of the total “amount” because they’re extremely high value payments.
I have first hand experience with such massive payments.
- At a Top 5 UK bank where I led the program to implement the TARGET-2 EU crossborder RTGS system in 2008, I once saw a €282 billion payment in the queue with my own eyes!
- When my ex-employer delivered it in circa 2005, this high value fund transfer system processed $1 trillion in payment value at a Top 5 US bank. Today, it processes $4 trillion per day.
Citi High Value Funds Transfer (CitiFT) Volumes:
* 2005: $1T / day.
* 2020: $4T / day.CAGR: 9.68%. pic.twitter.com/mezoLYJYMD
— Ketharaman Swaminathan (@s_ketharaman) October 5, 2020
So, once again, GDP is a very weak dipstick for payments.
If GDP is weak as a proxy for payments, what is strong?
Digital Payments Penetration Rate.
Let me illustrate this concept by using the second example from above.
Let’s say you paid for the coffee with a Credit Card.
Let’s doubleclick the payments made by the coffee shop owner to his suppliers and employees. Downstream payments involve a mix of payment methods, which is where things get interesting. As described in Leading Payment Rails, there are many methods of payment. For the purpose of Example-2, only the following MOPs are of interest:
- Cash
- Credit Card
- Account-to-Account Real Time Payment (retail / consumer payments) e.g. UPI (India), Zelle (USA), FPS (UK)
- Real Time Gross Settlement (corporate / business payments) e.g. RTGS (India), FedWire (USA), CHAPS (UK)
- Cheque
It’s safe to assume that the coffee shop owner did not pay his suppliers or employees with credit card (since acquirer banks typically won’t issue merchant accounts to them, without which they cannot accept credit card payments).
In the past, the coffee shop owner paid them with cheque or cash.
Now, since everybody has smartphones and bank accounts, they can accept UPI (provided the coffee shop is a sole proprietorship and not a private or public limited company since only current accounts of the former type of business support initiation of UPI payments.)
Using UPI for making downstream payments has generated an extra ₹80 in payment value for UPI without any increase in GDP. As a result, digital payment penetration rate has gone up.
In emerging markets like India, organized retail is only 10% of the total retail market. Mom-and-pop aka khirana stores rule retail. Supply chains inevitably comprise small businesses. Anecdotally, there are 70M nano and micro merchants in India (as against 7M in USA).
Because of the informal nature of the Indian economy, many B2B payments like supplier payments tend to happen with a B2C method of payment like UPI (above proviso regarding type of business applies).
A lot of public discourse around UPI revolves around consumer payments at the point of sale. But, as we can see, UPI sees volume and TPV from the downstream supply chain even when the consumer continues to pay with credit card at the till.
In developed countries, the coffee store is part of a chain and its supply chain comprises midsize to large enterprises. All downstream payments are made via RTGS (or ACH or Check). In other words, they are not made via UPI-equivalent methods of payments like Zelle. (Thanks to widespread use of Check-21 and Remote Deposit Check Capture technologies, even check effectively counts as digital payments in USA.)
As a result, the newly digitalized supply chain adds to UPI payment value in India whereas digital payments sloshing through the traditionally digitalized supply chain in developed markets are reflected in their higher RTGS values.
This is borne out by the TPV of real time payments (A2A RTP + RTGS) per year in the two countries:
- USA: $805T
- India: $19T
- Multiple: 42X
(For reference, the annual GDP of USA is $20.54T and of India is $2.7T, and the multiple is only 7.6X.)
Real Time Payments Value:
* USA: $805T
* India: $19TGDP:
* USA: $20.54T
* India: $2.7TUSA:India:
* RTP: 42X
* GDP: 7.6XGDP is a weak yardstick for RTP Value, which is driven much more by depth of supply chain & digital payments penetration rate than GDP.
— Ketharaman Swaminathan (@s_ketharaman) November 18, 2020
When friends shill UPI like this, who needs enemies, huh?
UPI volume grew 80 % from 1.14 billion transactions in October 2019 to 2.07 billion transactions last month. The transaction value jumped 101 %. In 4 years of its existence, it has double the no of transactions that American Express has globally – something which took 4 decades.
— Amitabh Kant (@amitabhk87) December 18, 2020
UPI is an A2A rail in India whereas American Express is one out of the many Credit Card rails in USA (Visa, MasterCard and Discover being the others).
Comparing UPI payment value in India with AmEx credit card payment value in USA is like comparing the size of automobile market in India with the sales of Ford Taurus in USA.
It reflects poor understanding of the payments industry and is a bad way of marketing UPI to the world.
As we’ve seen earlier, downstream payment value chain contributes to UPI TPV in India and to RTGS TPV (but not AmEx credit card TPV) in USA.
If at all a comparison is warranted, the valid metric would be total real time payments value. As we saw earlier, the difference between the two markets on that count is stark: USA does in merely 9 days what India does in a whole year.